Negative Cash Flow Rental: How Much Appreciation Do You Need? (3.7%)
22 View

- Publish Date:
- October 4, 2026
- Category:
- Appreciation Investing
- Video License
- Standard License
- Imported From:
- Youtube
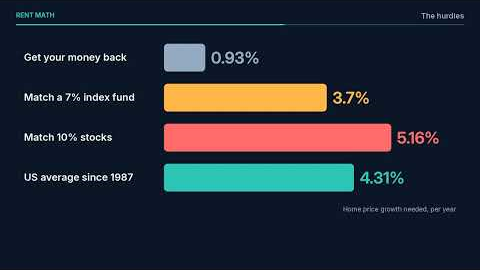
The episode 1 rental loses $417 a month. Held for 10 years, it needs about 3.7% a year of price growth just to match a 7% index fund, and 5.2% to match 10%. Flat prices lose about $27,000. US home prices have averaged 4.3% a year since 1987, with a 27% fall from 2006 to 2012.
New here? Start with episode 1: https://youtu.be/IKct8riTrvk
CHAPTERS
0:00 Betting on appreciation
0:31 The setup
1:02 Three futures
1:42 The hurdles
2:11 What history says
2:37 Why it still tempts people
3:04 Before you bet on growth
SOURCES
• S&P Cotality Case-Shiller US National Home Price Index, data table (FRED): https://fred.stlouisfed.org/data/CSUSHPINSA.txt
• Case-Shiller index history (MacroRadar): https://www.macroradar.io/case-shiller-home-price-index
• S&P 500 average returns (Fidelity): https://www.fidelity.com/learning-center/trading-investing/sp-500-average-return
• Freddie Mac PMMS, 30-yr fixed 7.03% (week of Sep 24, 2026): https://www.globenewswire.com/news-release/2026/09/24/3368592/0/en/mortgage-rates-average-7-03.html
ASSUMPTIONS
• Hold for 10 years, then sell
• Rent and running costs +3% a year
• Selling costs ~6%
• Case-Shiller US National Home Price Index, Jan 1987: 63.732 (FRED)
• Case-Shiller US National Home Price Index, Jun 2026: 336.663 (FRED)
• Case-Shiller national index, Jul 2006 peak: 184.607 (FRED)
• Case-Shiller national index, Feb 2012: 133.987 (FRED)
• Index fund, cautious 7% a year
• S&P 500 average ~10% a year since 1957 (Fidelity)
• Episode 1 house: $300,000, 25% down at 7.78%, $14,395 year-1 net operating income
• Income taxes ignored
This video is for education, not financial, tax or legal advice. Check the numbers for your own market.
Narration uses an AI voice. Research, calculations and script are checked by a person before publishing.
#negativecashflowrental #realestateappreciation #homepricegrowth
TAGS:
negative cash flow rental, real estate appreciation, home price growth, Case-Shiller, rental property, real estate investing, IRR, leverage, housing market history, rental property analysis